

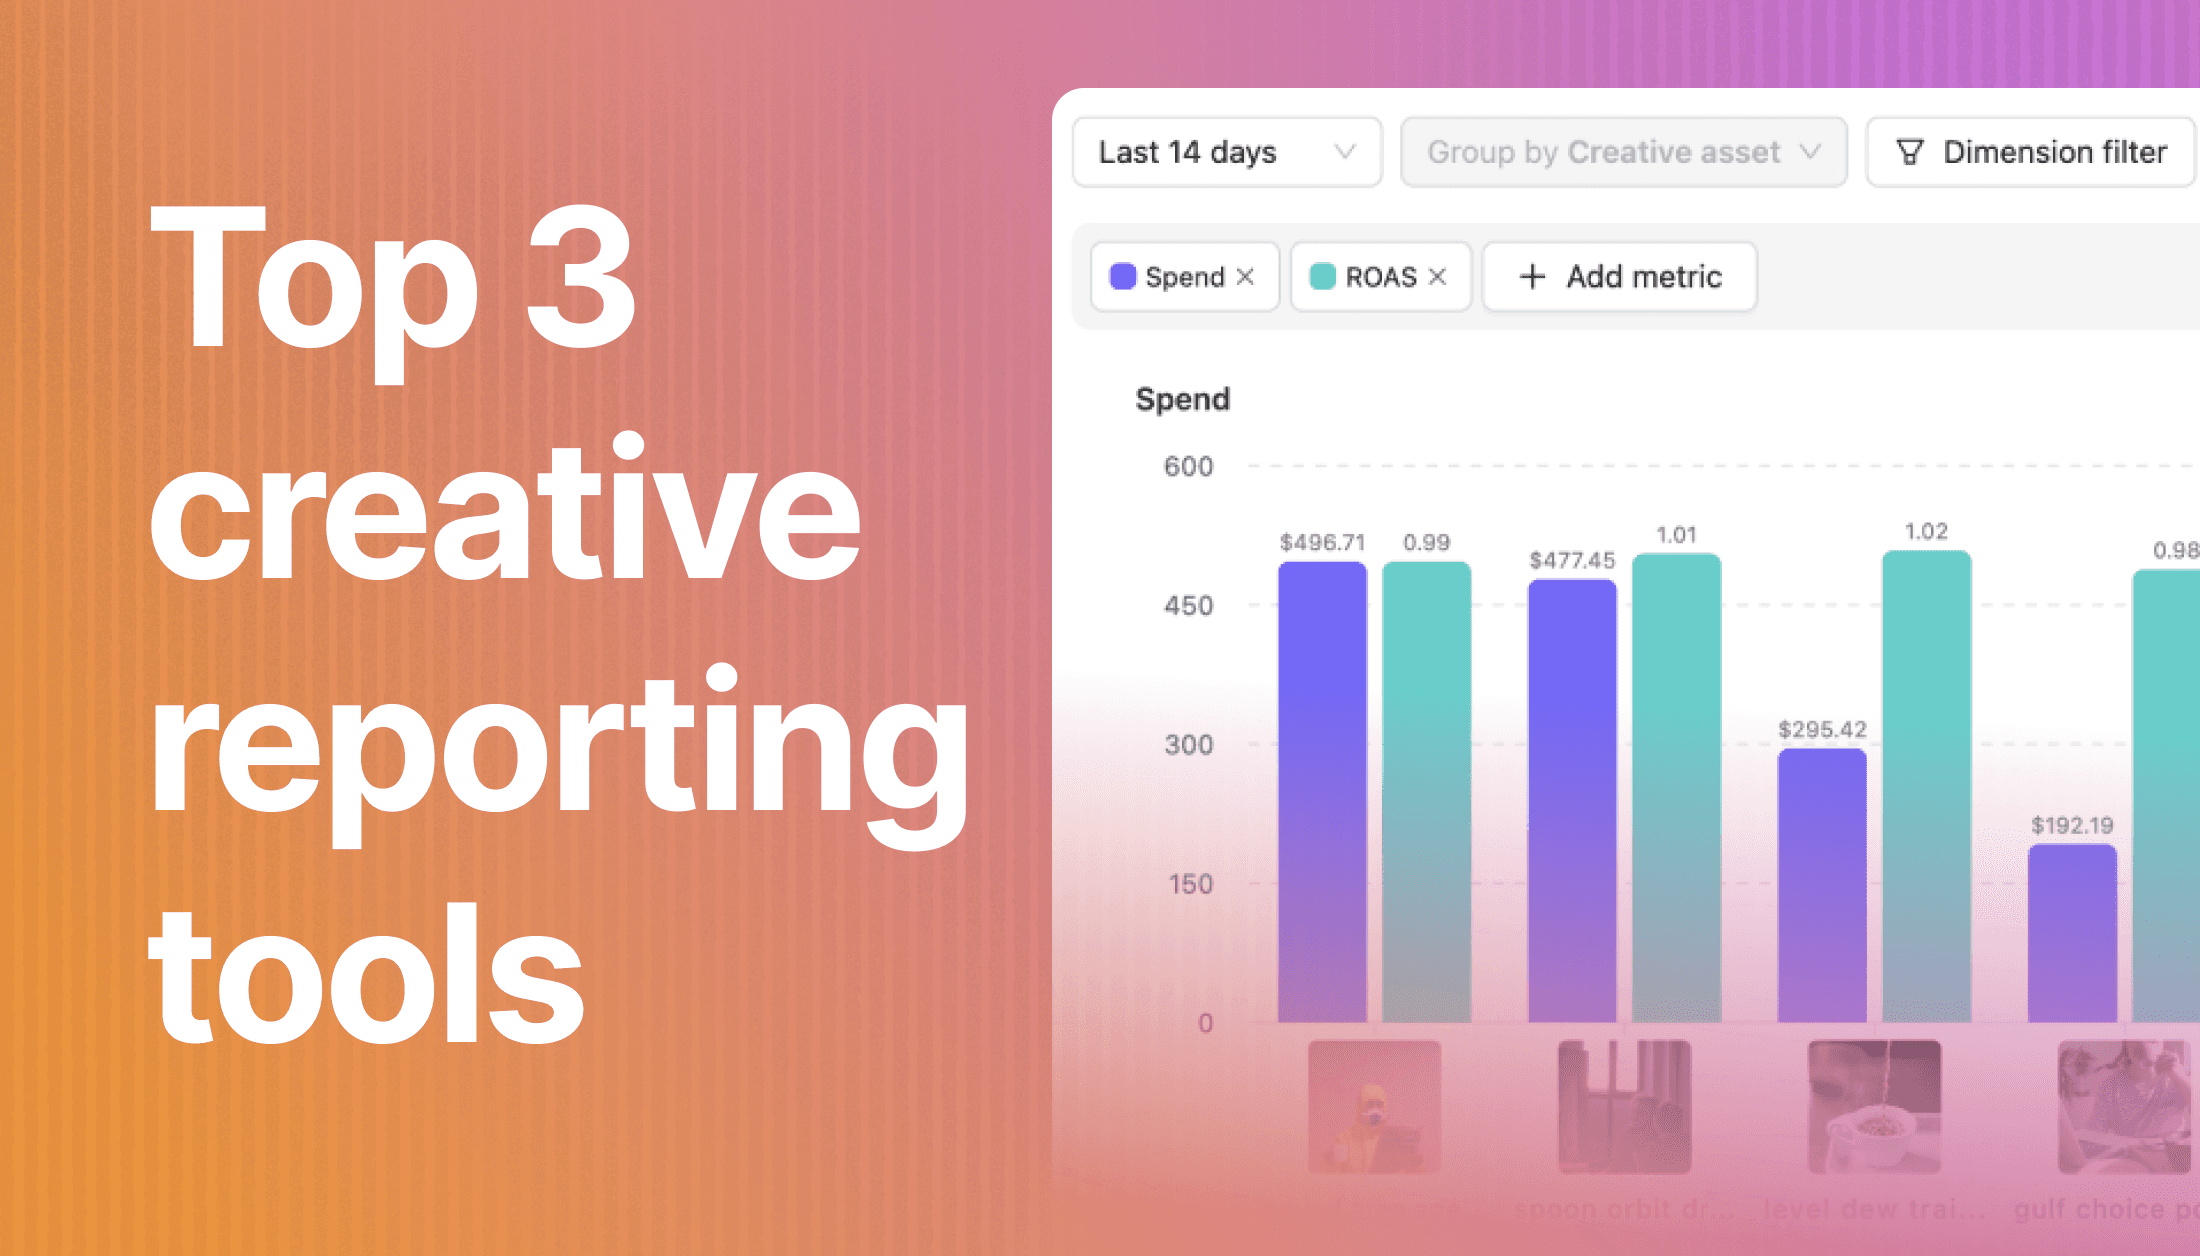

3 creative reporting tools for brands who hate Meta dashboards
Oct 29, 2025
|
5
min read
Every week you spend guessing which creative to make next costs you money. Real money.
When you're staring at performance data without clear direction, you're either iterating on the wrong ads, killing winners too early, or wasting budget testing concepts that were never going to work.
The irony is, you probably have all the data you need to make better decisions. It's just buried in reporting tools.
Traditional reporting tools like Facebook ads reporting tools and Meta's native interface were built for analysts, not creatives. They tell you what happened last week with beautiful charts and graphs, but leave you hanging when you need to know what to do about it. Even simple questions like “which hooks are performing best?” take 20 minutes to answer.
This is changing. AI-powered creative reporting is shifting how teams analyze ad performance. The move is away from descriptive analytics (“here's what happened”) to prescriptive insights (“here's what to do next”).
Let's break down how to choose a creative reporting tool in 2025.
Key takeaways
Traditional creative reporting wastes money: Without clear data insights, teams iterate on wrong ads, kill winners early, or waste budget on concepts that won't work
Most reporting tools fail creative teams: Built for analysts, not creatives, they show what happened but don't guide what to do next
AI is transforming creative analytics: Shifting from descriptive analytics ("here's what happened") to prescriptive insights ("here's what to do next")
Great tools nail three things: Make data accessible to non-analysts, connect performance to creative elements, and provide actionable next steps
Automatic tagging changes everything: AI categorizes creative elements automatically, letting you spot patterns across winners in seconds instead of hours
Top platforms compared: Atria excels at connecting insights to action ($129-479/mo), Motion delivers beautiful reports ($850-1150/mo), Superads offers deep customization ($799/mo)
Five weekly reports matter most: Top performers by spend, hook performance, format breakdown, iteration candidates, and creative element analysis
"Good enough" isn't anymore: While competitors use AI-powered insights to make faster creative decisions, teams stuck with basic reporting tools keep guessing
What makes a great creative reporting tool (and why most fall short)
Almost every creative reporting tool claims to do the same thing. They all promise “actionable insights” and “performance visibility.” But when you're actually using these platforms day-to-day, the differences become obvious fast.
The tools worth paying for nail three specific things:
Make data accessible to non-analysts. Your creative strategists and designers shouldn't need a degree in data science to understand what's working. The best platforms translate complex ad performance metrics into visual insights that creative teams can actually use and share with stakeholders. Clean dashboards, intuitive filters, and stakeholder-friendly reports that don't require a 20-minute explanation.
Connect performance to creative elements. It's not enough to know that Ad A outperformed Ad B. You need to understand why. Was it the hook? The offer? The creator? The music? The best creative reporting tools automatically tag and categorize creative elements so you can spot patterns across your winning ads.
Provide actionable next steps. This is where most platforms completely drop the ball. Showing you a graph of your CPA over time is useless if you don't know what creative decisions to make based on that data. The new generation of reporting tools uses AI to analyze your performance and tell you specifically what to iterate, scale, or kill.
How AI is reshaping creative reporting
AI is doing for creative reporting what calculators did for math. It's not replacing human judgment. It does the manual analysis work so you can spend your time making creative decisions.
Here's what AI-powered creative reporting does:
Automatic creative tagging. Instead of manually categorizing every ad by format, hook type, creator, and offer, AI analyzes your creatives and tags them automatically. You can instantly filter your top performers by any element you care about.
Pattern recognition at scale. AI can spot trends across thousands of ads that would take humans weeks to identify. It notices that your testimonial-style hooks consistently outperform product-focused ones, or that ads featuring women drive 30% lower CPAs than those featuring men.
Platforms like Atria analyze your entire ad library to surface these patterns, connecting performance data to specific creative decisions.
Predictive recommendations. The most advanced platforms analyze your performance data against billions in aggregated ad spend to identify which creatives have scaling potential and which are likely to plateau.
Creative intuition gets you halfway there. AI-powered insights get you the rest of the way, without the hours of manual analysis.
The top 3 creative reporting tools compared
We tested all three platforms with real ad accounts, talked to teams who've used them daily, and cut through the marketing speak. Here's what each tool actually does well, where it falls short, and who should use it.
1. Atria: The comprehensive creative reporting tool
Atria bundles three tools into one: analytics to understand what's working, competitor research to see what others are doing, and creative production to actually build your next ads.
Instead of just showing you performance data, it connects the dots between what's working and what to create next. Instead of analyzing in a vacuum, you see your performance in the context of the broader industry landscape.
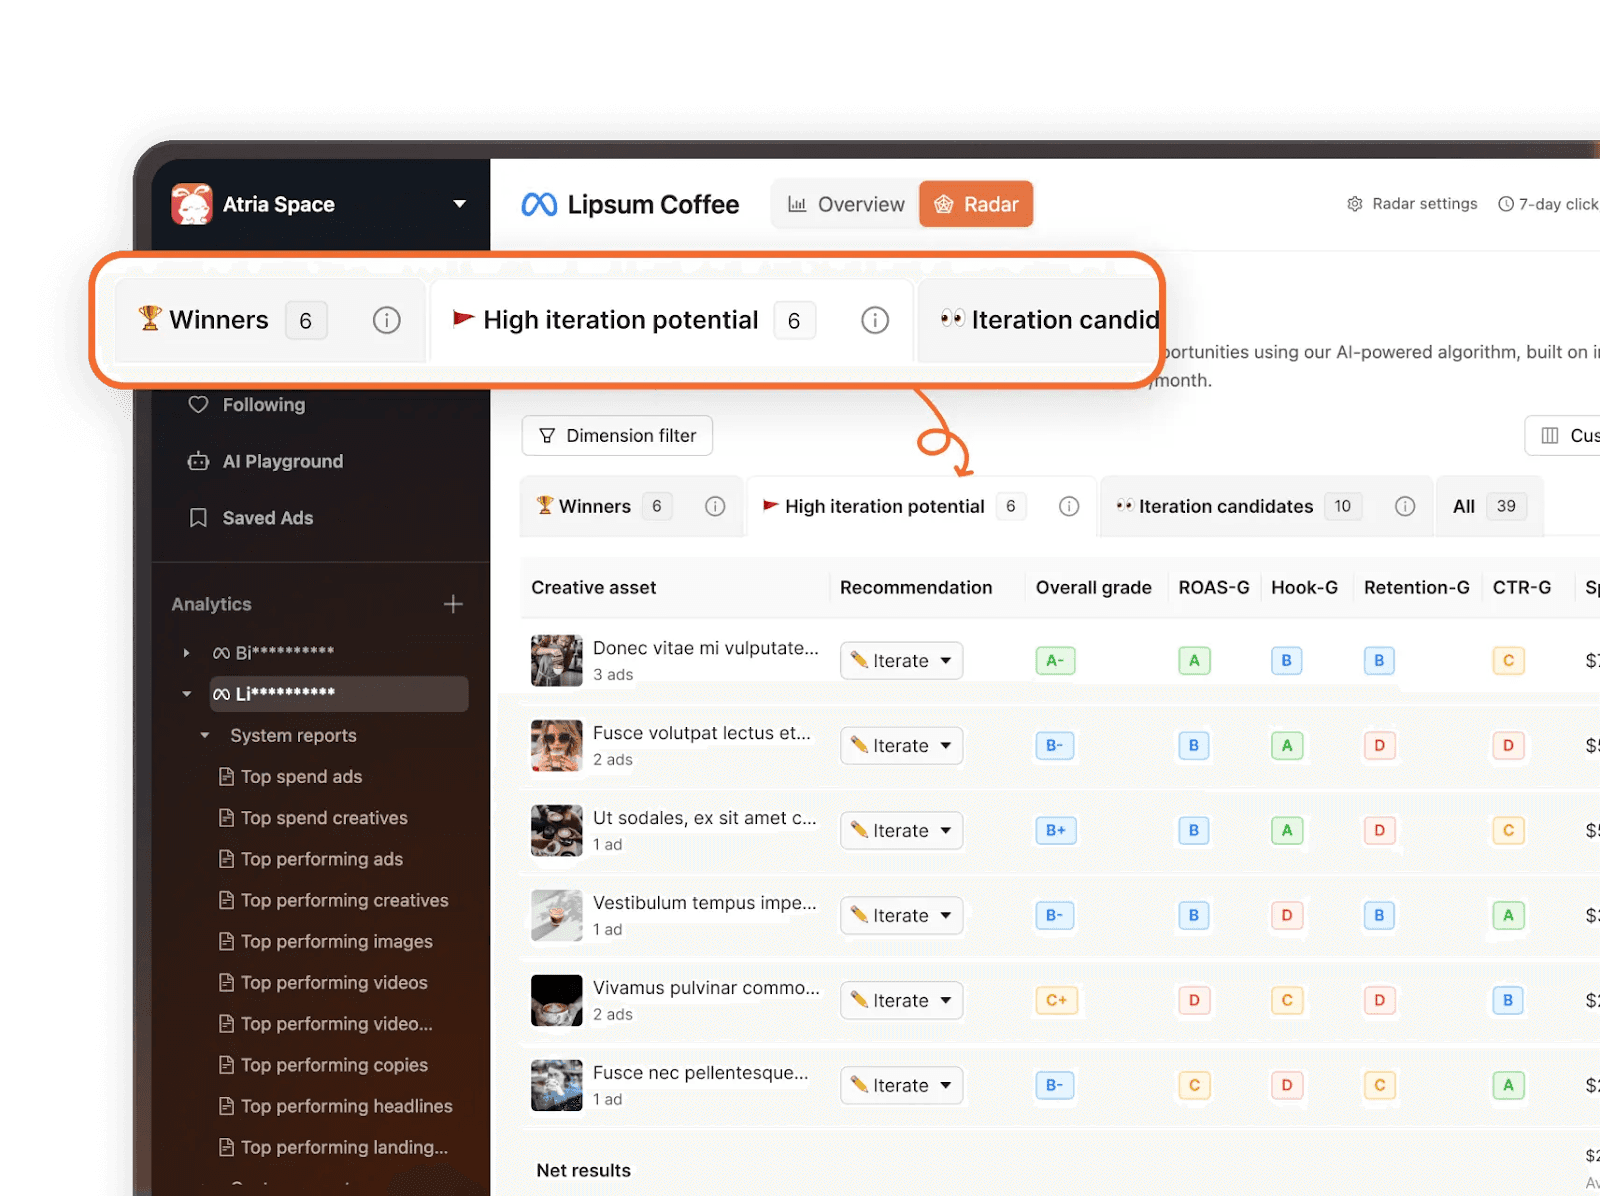
The standout feature is Radar, which analyzes your last 90 days of ad performance and categorizes ads into winners, high iteration potential, and iteration candidates. Each comes with specific AI recommendations about whether to scale, iterate, or kill. The AI surfaces these insights automatically, so you don’t have to learn how to prompt. It tells you exactly what to change and why.
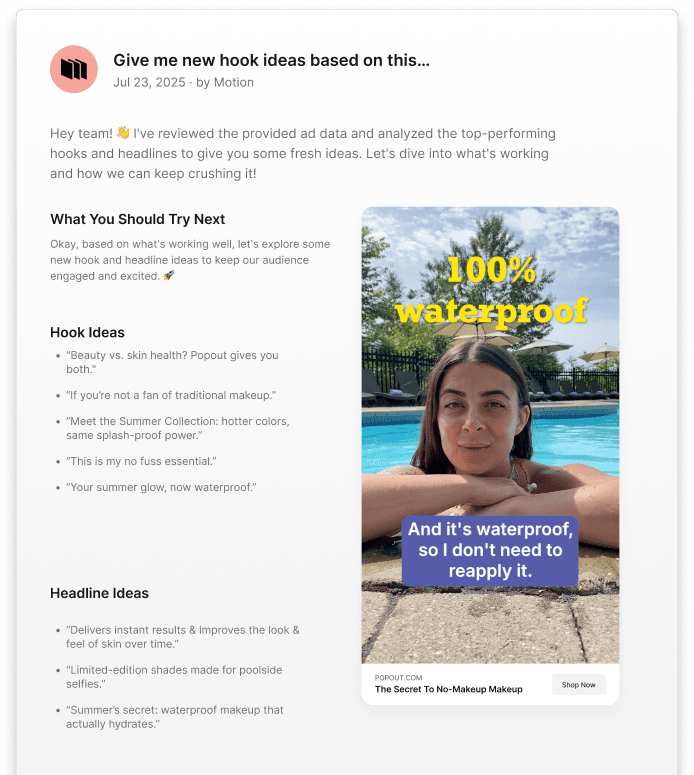
But Atria doesn't just stop at insights. Once you identify what's working (or what competitors are doing successfully), you can generate new iterations directly in the platform based on those learnings. See a competitor's hook crushing it? Adapt the concept. Notice your testimonial ads outperforming? Create variations instantly.
Custom reports let you build dashboards tailored to different roles. Media buyers can focus on spend and CPA comparisons. Creative strategists can analyze hook performance and thumb-stop rates. Everyone sees the metrics they care about without the noise.
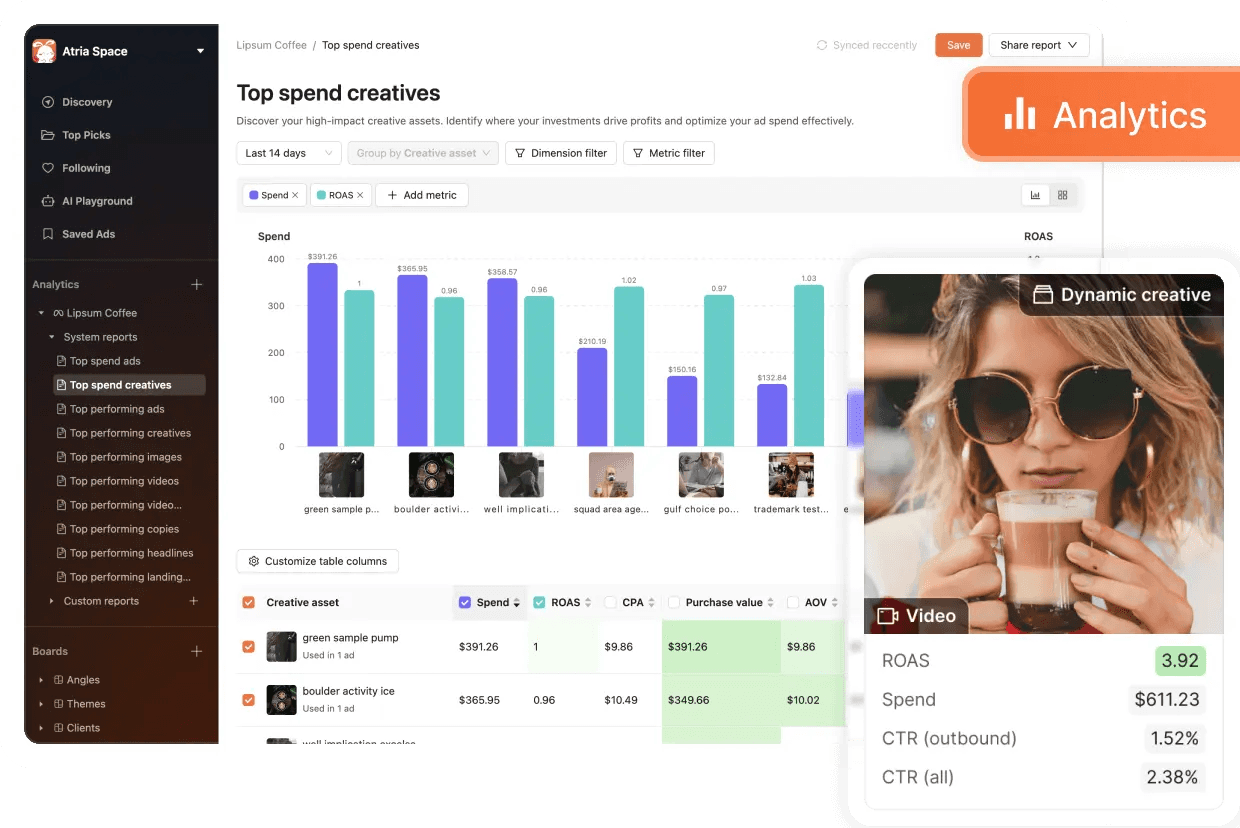
The platform auto-tags creative elements so you can filter top performers by any characteristic. Want to see which video hooks drove the lowest CPA over the last 30 days? Two clicks. Need to compare static ads versus video performance by age group? Done.
Where Atria excels: Connecting performance insights to actionable creative decisions. The platform doesn't just tell you what happened, it tells you what to do about it. Teams report cutting iteration cycles in half because they’re no longer guessing what to create next.
Pricing starts at $129/month for the Core plan. There’s a free trial as well (see the most up-to-date pricing).
2. Motion: Built for visual reporting
Motion built its reputation on gorgeous, stakeholder-friendly reports. Need to present to executives? Motion makes your data look good and easy to understand.
Clean dashboards across all your connected ad accounts make complex performance data actually digestible. Reports are shareable and stakeholder-friendly—the kind that actually get opened.
Where Motion falls short: It's primarily a reporting tool, not a creative intelligence platform. You get beautiful analytics about what happened, but limited guidance on what to do next. There's no creative production support, basic competitor tracking, and minimal actionable recommendations.
The pricing is also steep. Growth plans start at $850-$1,150 per month (with a 3-month commitment). You'll likely need supplementary tools for competitor research and creative iteration.
Motion makes sense if visual reporting is your primary need, budget isn't a constraint, and you're comfortable using multiple tools for different workflow stages.
3. Superads: Customization for data lovers

Superads takes dashboard customization to the next level. If you want complete control over how your analytics are displayed and like diving deep into data, this platform delivers.
Instead of building reports manually, you can chat with your ad data and get instant visual answers to your questions. Multi-client support makes it solid for agencies that manage multiple brands.
The free tier (up to 3 reports, 30 days of data) makes it accessible for small teams to test before committing.
Where Superads falls short: It's analytics-only. No competitor research, no creative production tools, no iteration guidance. Once you understand your data, you're on your own to figure out what to do with it. Plus, you need to be good at prompting to get what you need out of the tool.
Pricing hits $799/month for larger teams with $500K+ ad spend. That's steep for a reporting-only tool.
Superads works best for small teams using the free tier. It's also solid if you want deep dashboard customization without creative workflow tools.
Key features to look for in a creative reporting tool
When evaluating creative reporting tools and analytics platforms, prioritize these capabilities:
Visual clarity over data density. More data isn't better if nobody can understand it. Look for platforms that make insights scannable at a glance. Clean visual hierarchies, intuitive navigation, and reports you can actually share with stakeholders without a 20-minute explanation.
Flexible filtering and segmentation. You need to slice performance data by creative element, audience characteristics, and time periods. This shouldn't take 30 minutes of wrestling with the interface.
Creative element tagging. You need to spot patterns across your ad library fast. Look for tools that auto-tag creative elements so you can filter winners by hook, format, offer, or whatever matters to your strategy. Atria handles this automatically, letting you filter top performers by any characteristic in two clicks.
Custom report building. Different team members need different views of the data. Media buyers care about spend and CPA. Creative strategists focus on engagement metrics and creative elements. Your reporting tool should let each person build the dashboard they need.
Performance recommendations. Look for platforms that not only show you data but also tell you what to do with it. Which ads to scale, which to iterate, which creative elements to double down on. Take Atria's Radar feature, for instance. It categorizes ads into winners, high iteration potential, and iteration candidates, with specific AI recommendations for each.
Easy sharing and collaboration. Reports you can share in one click, not 47 screenshots stitched together in a Google Doc. Bonus points for commenting features and team collaboration tools.
Make creative reporting work for your team
Checking your dashboard shouldn't be a crisis response. Here's how teams that actually improve their creative use of reporting tools:
Monday morning performance reviews. Start the week by reviewing what happened over the last 7 days. Which ads exceeded expectations? Which underperformed? Use this to inform your creative priorities for the week ahead.
Winner identification meetings. Every two weeks, identify your top performers and plan iterations. Look at ads with strong early performance and decide what variations to test. Teams using Atria's Radar feature do this in 15 minutes.
Monthly trend analysis. Zoom out to spot patterns across your creative library. Are certain hooks consistently outperforming? Are specific offers driving better results? Use these insights to inform your broader creative strategy.
Client reporting. Build shareable reports that show stakeholders exactly why you're making the creative decisions you're making. Visual reports that connect performance to specific creative elements make budget conversations much easier.
The reports you should be running weekly
Ask any high-performing creative team what reports they run, and you'll hear the same five. They're not the flashiest or most comprehensive, but they'll actually help you decide what to create.
They're comparing ad angles. How are lifestyle ads performing versus how-to content? Are testimonials beating product demos? With platforms like Atria's automatic tagging, these comparisons that used to take hours now happen instantly. You can slice your data by any creative angle or element that matters to your strategy.
Top performers by spend. Your highest-spend ads, sorted by your primary KPI (usually CPA or ROAS). This shows you what's actually driving results at scale, not just what worked in a small test.
Hook performance comparison. Filter your video ads by hook type and compare thumb-stop rates and watch-through rates. Identifies which hooks deserve more testing and which to avoid.
Format performance breakdown. Compare static images, carousels, and video ads across key metrics. Helps you allocate creative resources to the formats that perform.
Iteration candidates. Ads are showing early promise but not quite hitting winner status. These are your best opportunities for quick improvements through small changes.
Creative element analysis. Break down performance by offer type, creator, music choice, or any other element you're testing. Spot patterns you'd never notice manually.
The goal isn't to get bogged down in reports. It's to run the specific analyses that inform your next creative decisions.
Why “good enough” reporting is no longer “good enough”
Most creative teams operate on intuition because their reporting tools make data analysis feel like punishment. The spreadsheets, the manual tagging, the hours spent trying to answer simple questions.
The new generation of creative reporting tools are built differently. They make understanding performance as easy as scrolling through Instagram, and they connect insights directly to action.
If you're still using Facebook ads reporting tools that leave you staring at numbers, thinking, “Cool... now what?”, it's time to upgrade.
Your competitors are already making this shift. Will you join them or keep guessing?
Start with a free trial. Most platforms, including Atria, offer 7-day trials with full feature access. Run it alongside your current setup for a week and see which one actually helps you make better creative decisions. The answer usually becomes obvious pretty quickly.
Frequently Asked Questions
What's the difference between creative reporting tools and ad analytics platforms?
Creative reporting tools focus specifically on analyzing ad creative performance, including hooks, formats, creative elements, and areas for iteration. Ad analytics platforms typically focus on broader campaign metrics, such as spend, conversions, and audience performance. The best creative reporting tools do both, but with an emphasis on helping you decide what creative to make next.
Do I need a creative reporting tool if I'm already using Meta Ads Manager?
Meta Ads Manager shows you performance data, but it's not designed to help you make creative decisions efficiently. You'll spend hours trying to answer basic questions like "which hook types perform best?" Creative reporting tools make this analysis instant and provide actionable recommendations that Meta doesn't offer.
What's the learning curve like for these tools?
Most modern creative reporting tools are designed for non-technical users and can be learned in a day or two. Platforms like Atria and Foreplay prioritize intuitive interfaces. More complex tools like Smartly or heavily customizable platforms like Superads may require longer onboarding. Most offer free trials so you can test the ease of use before committing.
How do AI recommendations actually work in creative reporting tools?
AI analyzes your ad performance against patterns in large datasets (often billions in ad spend) to identify what's working and why. It looks at creative elements, audience response, and performance trends to categorize ads (winners, iteration candidates) and provide specific recommendations (scale this, change that hook, kill this underperformer). The AI doesn't make decisions for you—it just speeds up analysis that would take hours manually.
Can I migrate my saved ads and boards from my current tool?
Many platforms offer migration assistance. Atria, for example, provides free migration help from Motion, Foreplay, and other platforms. Just email their support team. This makes switching less painful since you don't lose your organized ad libraries and research.
Do these tools replace my creative strategist or media buyer?
No. Creative reporting tools enhance what creative strategists and media buyers do by eliminating tedious analysis work. They provide insights faster, so your team can spend more time on strategy, iteration planning, and actual creative decisions rather than wrestling with spreadsheets.
What reports should I actually be looking at weekly?
Focus on five core reports: top performers by spend (sorted by your primary KPI), hook performance comparison, format performance breakdown, iteration candidates, and creative element analysis. These directly inform what creative to make next, rather than just showing vanity metrics.

